Welcome to Onagre
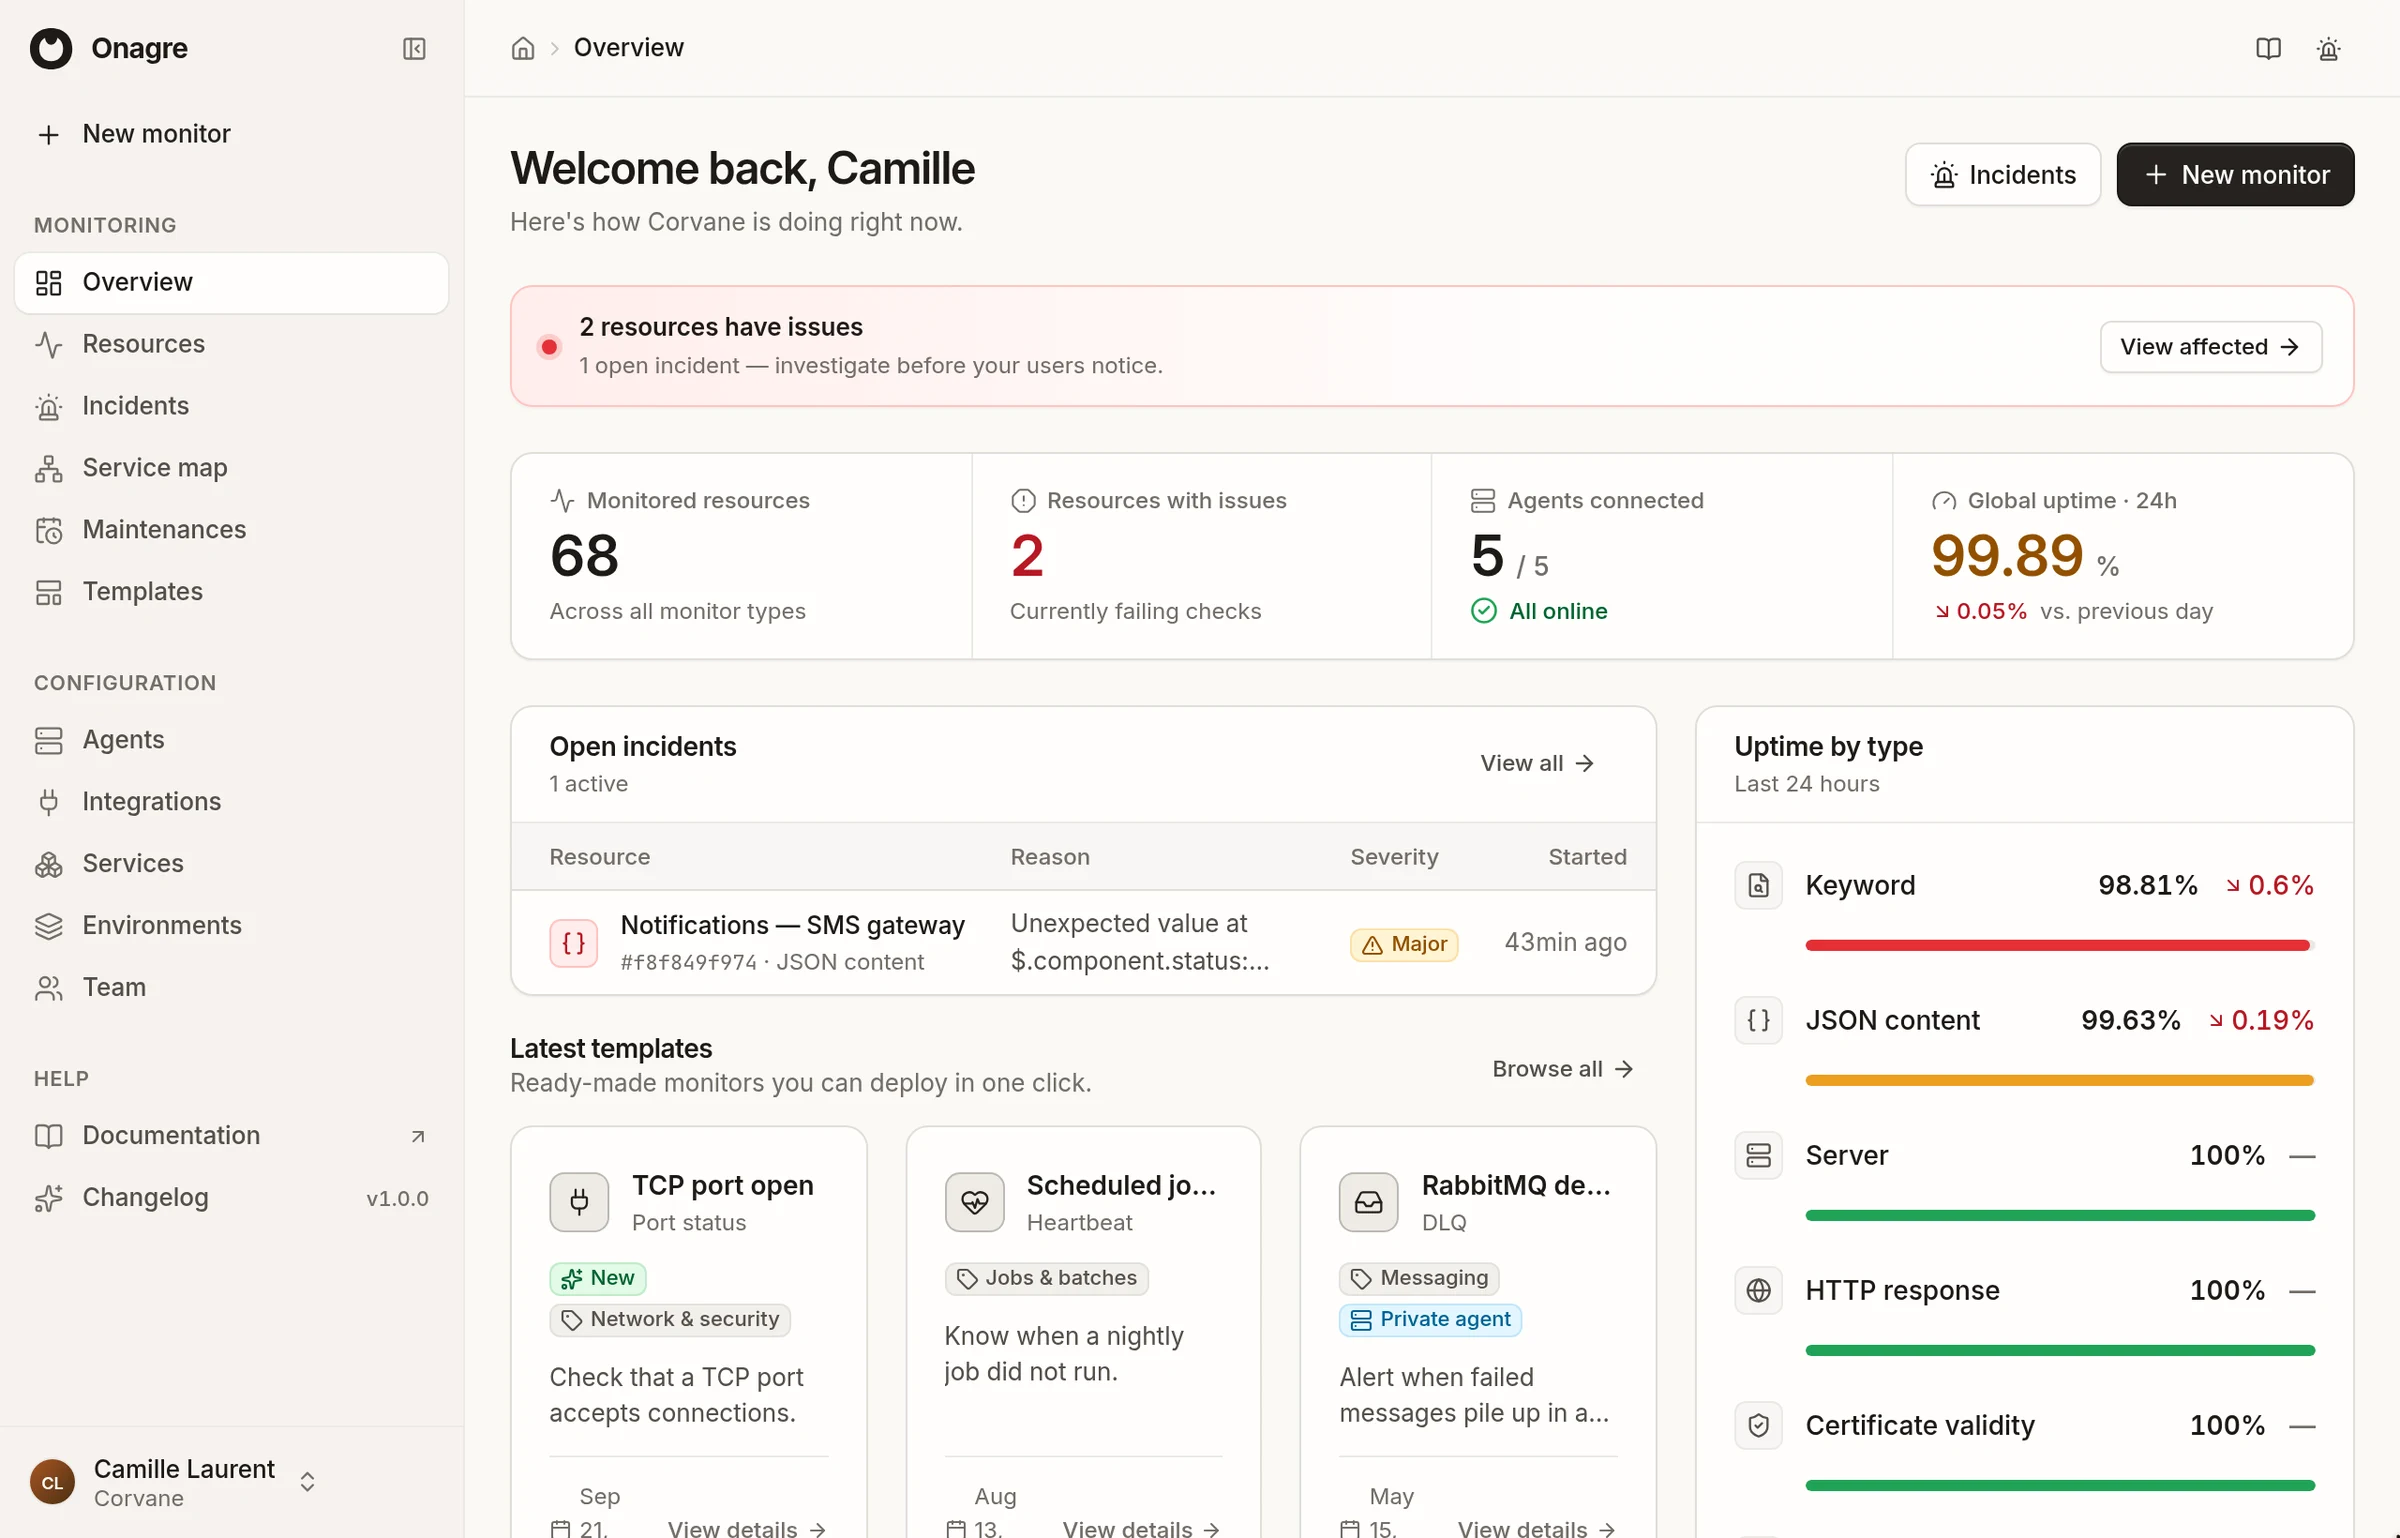
Onagre watches the applications and services your users depend on — websites, APIs, databases, queues, scheduled jobs — and tells your team as soon as one of them stops working.
You describe what to check; Onagre runs the check on a schedule, opens an incident when it fails and notifies the right people through Slack, e-mail, Teams, webhooks or the mobile app. When the check succeeds again, the incident is resolved and everyone is told.
What you can monitor#
| You want to know that… | Use |
|---|---|
| your website is up and shows the right content | HTTP or Keyword |
| your API answers, with the right data | HTTP, JSON or XML |
| a certificate or a domain name won't let you down | Certificate validity, Domain resolution |
| a host or a port is reachable | Ping, Port |
| a nightly job or a backup really ran | Heartbeat |
| a database, a Redis store or a RabbitMQ queue is healthy | SQL, Key-value, Dead-letter queue |
| a server has enough CPU, memory and disk | Server |
Public resources are checked from the internet by Onagre, with nothing to install. Resources inside your own network — an internal API, a PostgreSQL database — are checked by a small agent you install there; it only makes outbound connections. See Public and private monitoring.
Start here#
- Core concepts — sensors, incidents, alerting, agents, services and environments, in five minutes.
- Monitor your first website — create an account, add a first sensor and receive your first alert.
- Then go further: