Sensors
On this page
A sensor checks one thing on a schedule — a URL, a port, a database query, a queue — and decides whether it is healthy. Each result is recorded; a failure opens an incident and notifies the integrations linked to the sensor.
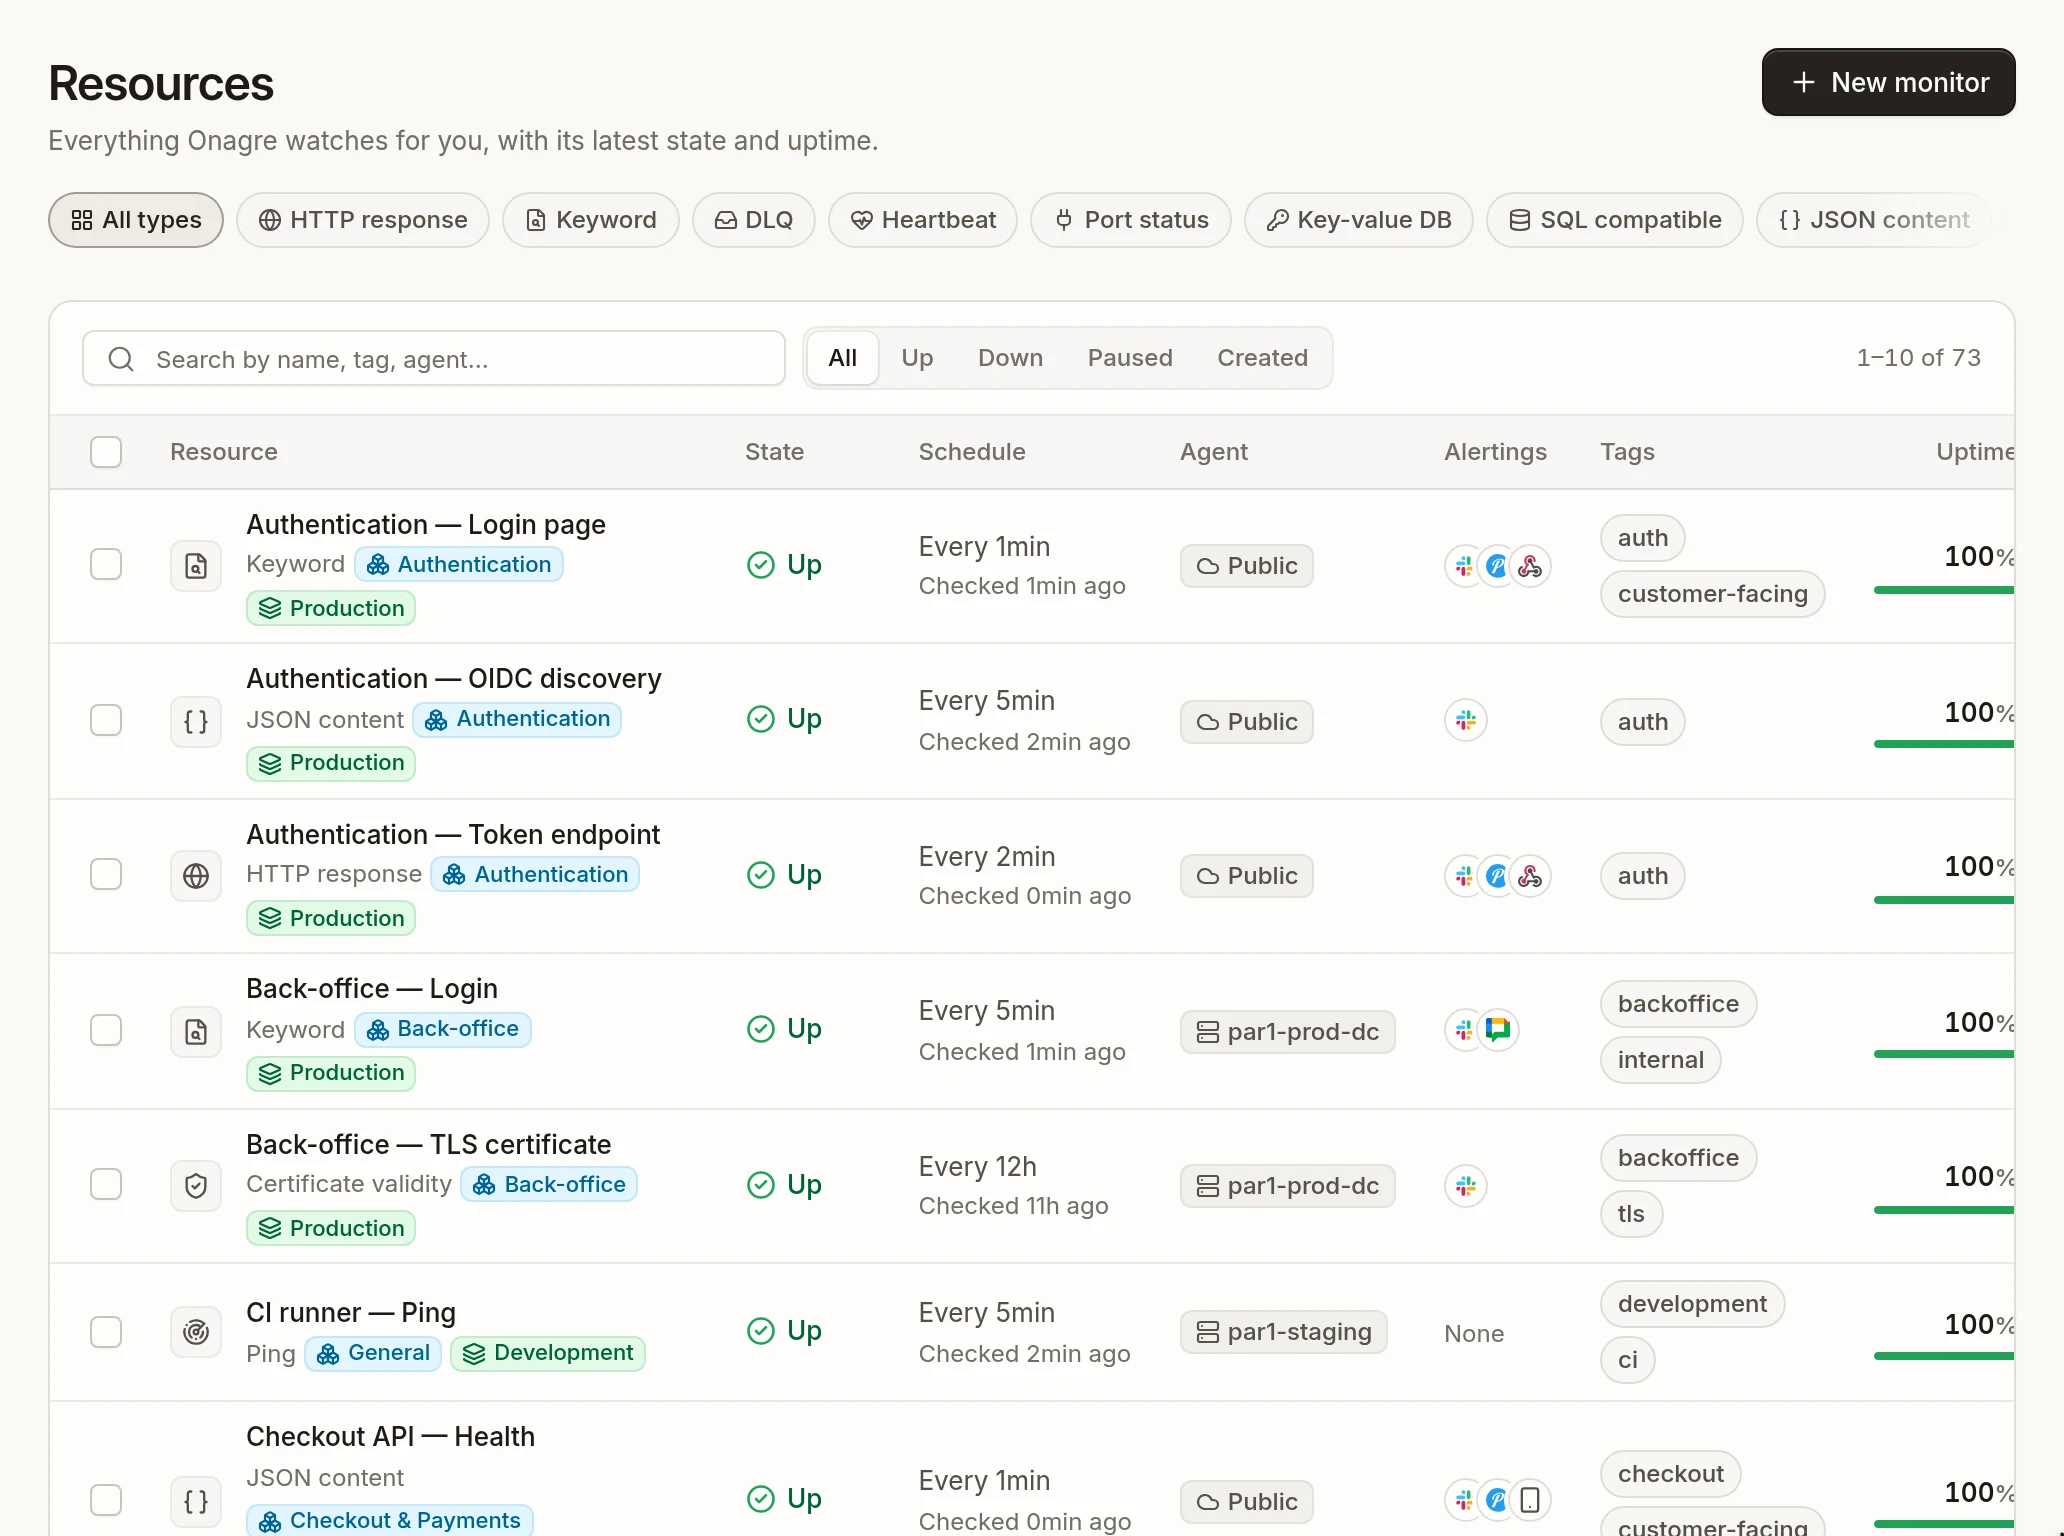
In the app, sensors are created with New monitor and listed under Monitoring → Resources.
Choose a sensor by need#
| What you want to check | Sensor | Runs from | Plan |
|---|---|---|---|
| A website or an endpoint answers | HTTP | public or private agent | all |
| A page contains (or not) some text | Keyword | public or private agent | all |
| A JSON API returns the expected value | JSON | public or private agent | all |
| An XML or SOAP endpoint returns the expected value | XML | public or private agent | all |
| A host answers ping | Ping | public or private agent | paid |
| A TCP port is open (or closed) | Port | public or private agent | paid |
| A domain name keeps resolving | Domain resolution | public or private agent | paid |
| A TLS certificate is not about to expire | Certificate validity | public or private agent | paid |
| A scheduled job, a backup or a script really ran | Heartbeat | your job calls Onagre | paid |
| A SQL database answers, or a query returns the right value | SQL database | private agent | Enterprise |
| A Redis store answers, or a key holds the right value | Key-value store | private agent | Enterprise |
| A RabbitMQ dead-letter queue is not filling up | Dead-letter queue | private agent | Enterprise |
| A file exists and has not changed | File checksum | private agent | Enterprise |
| A server has enough CPU, memory and disk | Server | created with each private agent | with agents |
"Paid" means any Pro or Enterprise plan. See Plans.
Public or private agent. The public agent runs checks from the internet and only reaches public addresses. Database, key-value, queue and file sensors need a private agent installed in your network, as does any check on a resource that is not reachable from the internet.
What every sensor has in common#
Every sensor, whatever its type, has:
- a name, a service and an environment — see Services and Environments;
- a schedule (how often it runs) and a severity (copied onto its incidents);
- an agent that runs it;
- an alerting list: the integrations notified when it opens or resolves an incident;
- optional tags to find and filter it.
All of these are set in the creation wizard — see Create and manage sensors.
How a check becomes an incident#
A single failed check opens an incident immediately; the first successful check resolves it. There is no retry and no confirmation by a second agent, so choose timeouts and conditions that reflect a real problem rather than a passing hiccup.
States#
| State in the list | Meaning |
|---|---|
| Up | The last check succeeded. |
| Down | The last check failed: an incident is open. |
| Waiting | The sensor has just been created and has not run yet (shown as Pending on its page). |
| Not checked | The sensor is late: it should have run but no result came back (shown as Late on its page). This usually means its private agent is offline. |
| Paused | Checks are suspended until you start the sensor again. |
| In maintenance | A maintenance window currently pauses its checks. |
In this section#
- Create and manage sensors — the wizard, common settings, editing, pausing, bulk actions.
- Results and history — what the sensor page shows: uptime, latency, charts, incidents, changes.
- Templates — ready-made sensors for common needs.
- One page per sensor type, listed in the navigation.