Results and history
Every check is recorded. A sensor's page — open it from Resources or from an incident — turns these results into the answers you need: is it up, how fast is it, how often does it fail, and what changed.
Header#
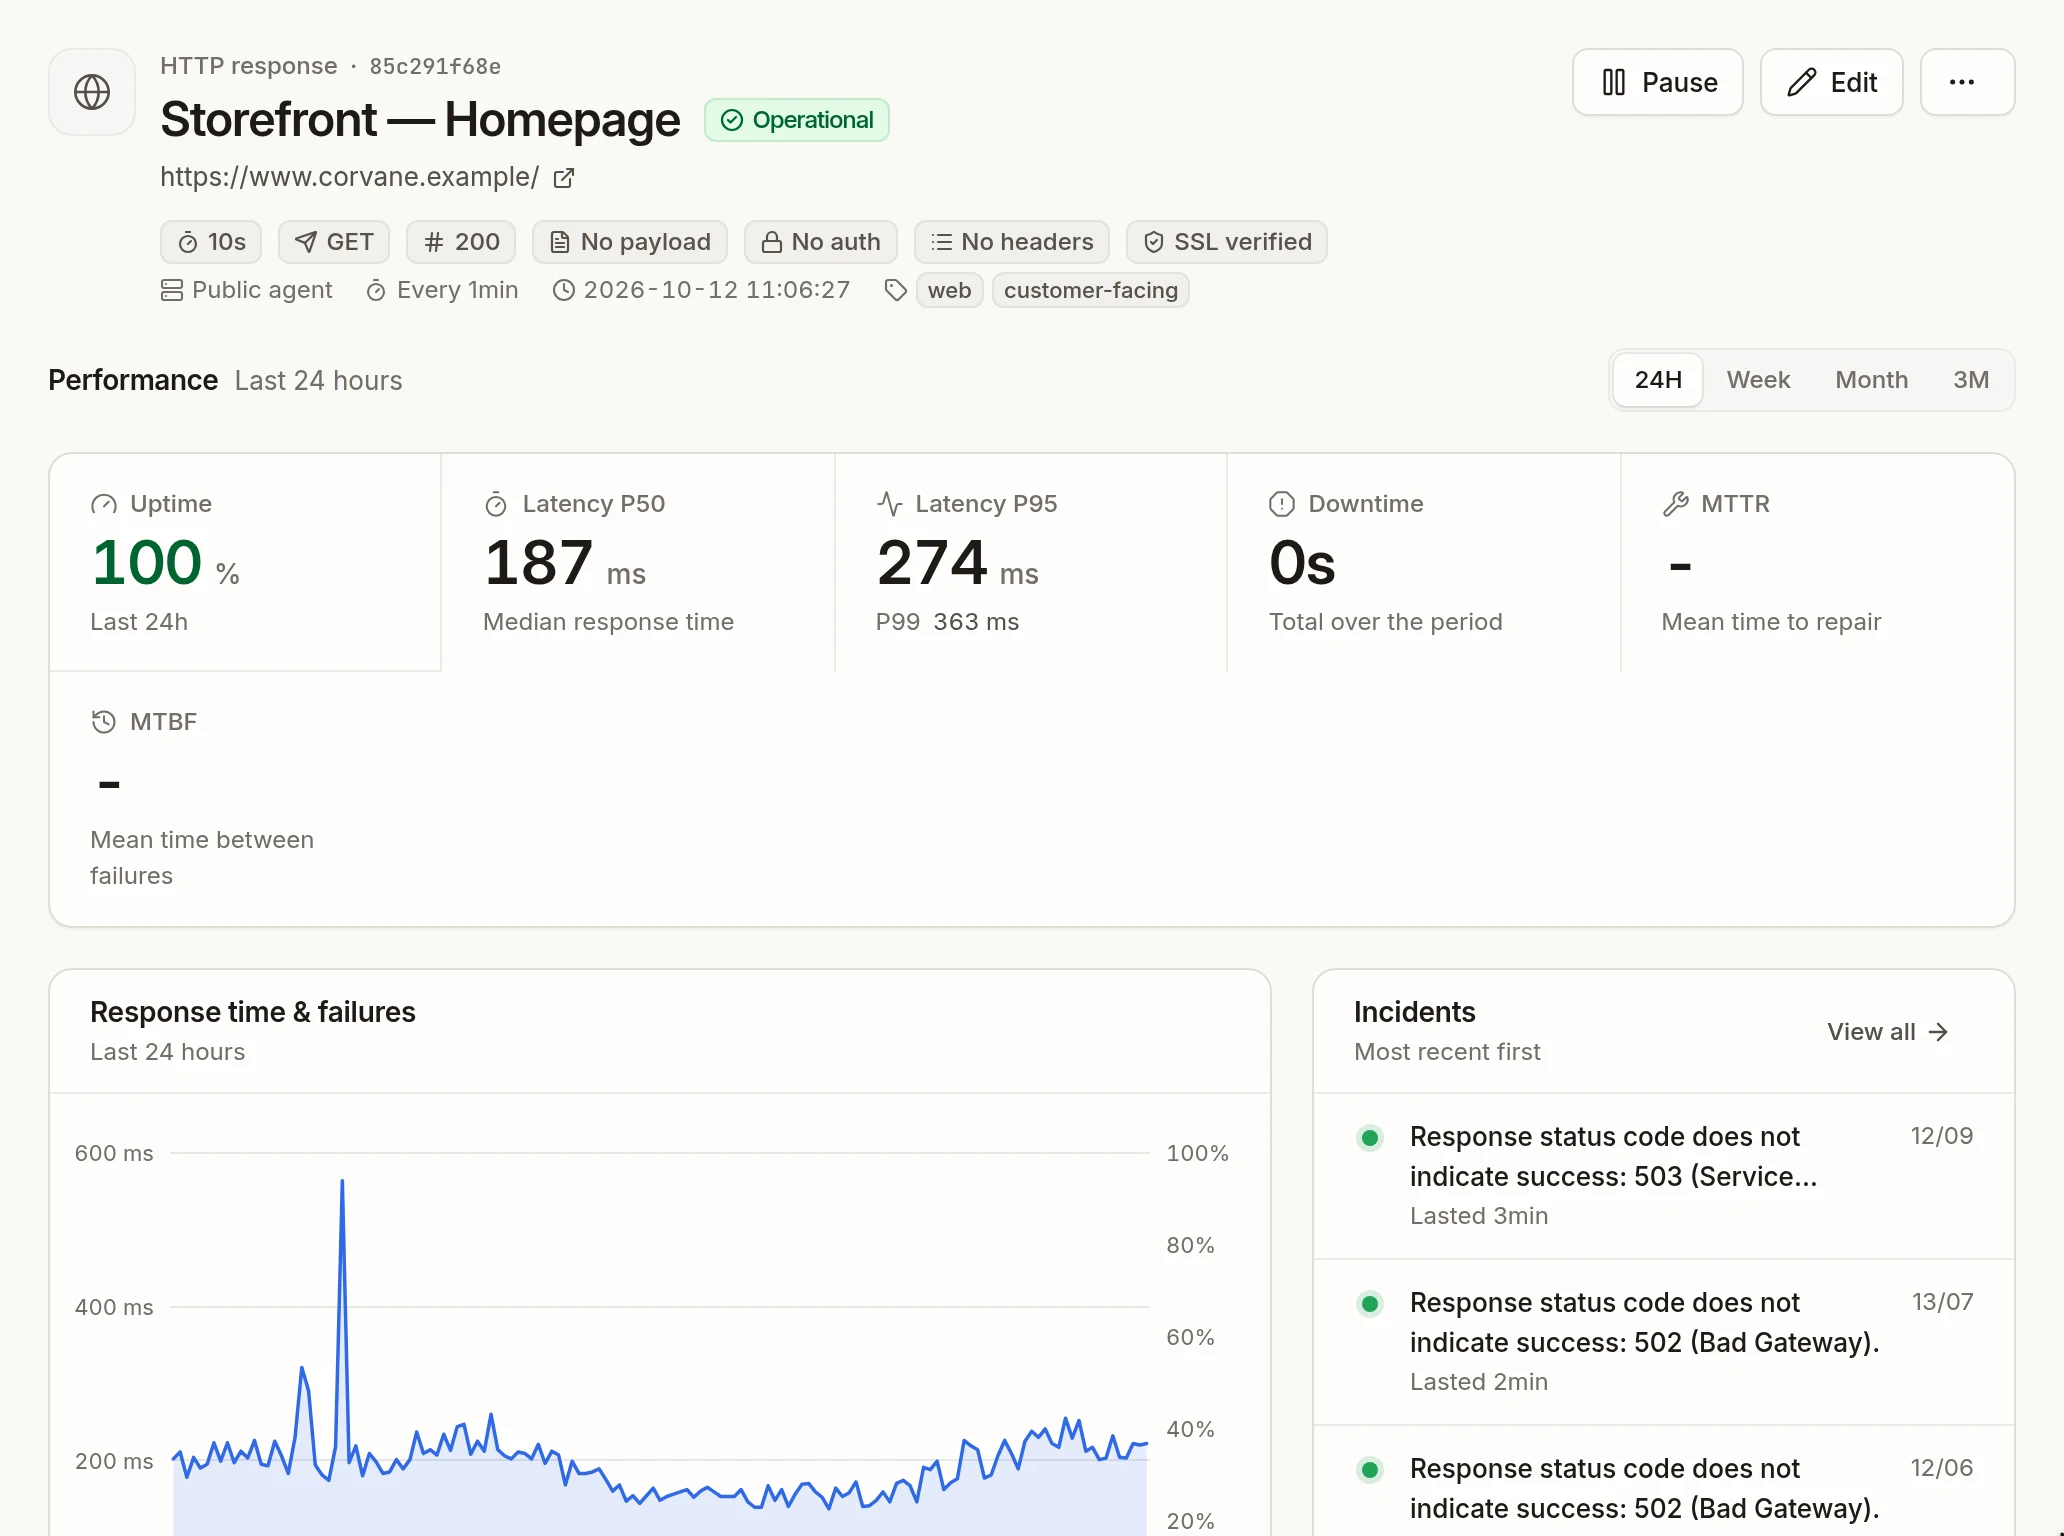
The header shows the sensor's name and code, its current state (Operational, Down, Pending, Late or Paused), the target it checks, its configuration at a glance (timeout, method, accepted codes…), the agent that runs it, its schedule, its tags, and the time of the last check. Pause, Edit and More actions are on the right.
Performance#
Choose the period — 24H, Week, Month or 3M — then read:
| Indicator | Meaning |
|---|---|
| Uptime | Share of successful checks over the period. |
| Latency P50 | Median response time: half of the checks were faster. |
| Latency P95 | 95% of the checks were faster than this; the P99 is shown below it. |
| Downtime | Total time spent with an open incident. |
| MTTR | Mean time to repair: how long incidents lasted on average. |
| MTBF | Mean time between failures: how long the sensor typically stays up between two incidents. |
Charts#
The chart plots the response time of each check, with:
- the failure rate for most types;
- the measured value for types that extract one — a JSON or XML value, a SQL or Redis value, the number of messages in a dead-letter queue;
- the days remaining before expiry for a certificate.
Spikes and steps make changes visible: a slower release, a migration, a renewed certificate.
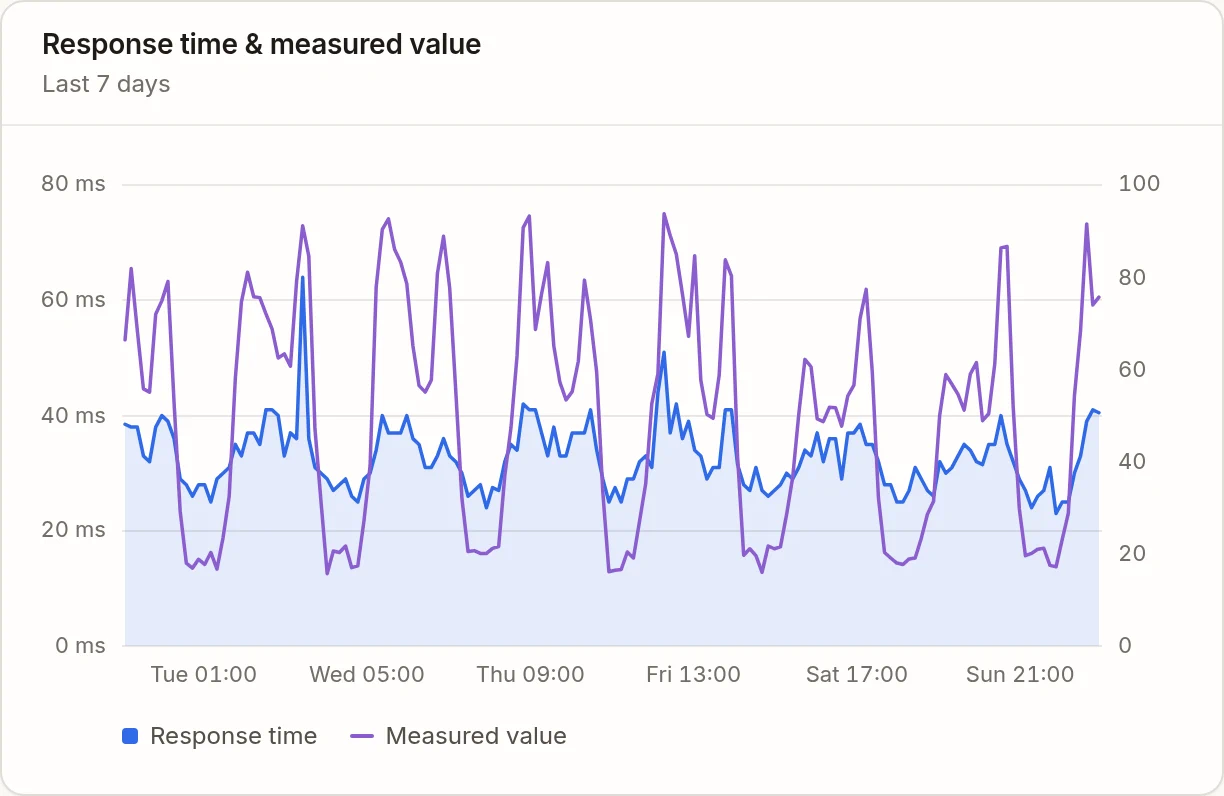
Server sensors show Server health (CPU and memory) and Disk space instead.
Incidents, alerting and services#
- Incidents lists the sensor's latest incidents, ongoing or resolved; click one to open it.
- Alerting shows the integrations notified when an incident opens. No alerting configured means incidents on this sensor notify nobody.
- Service dependencies places the sensor's service among the services it depends on and those that depend on it — see Service Map.
Change history#
Change history lists the configuration changes made to the sensor over the selected period: useful when a sensor starts failing right after someone edited it.